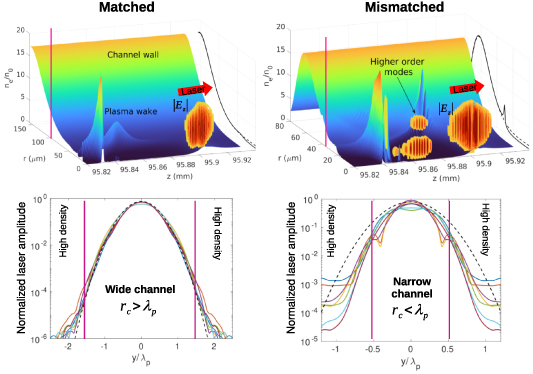
Concept of the single-mode guiding for a relativistic-intensity Gaussian laser pulse: We show the matched case on the left and the mismatched case is on the right. The figures in the top show the plasma density after ∼10 cm of propagation overlaid with the vertical cross-section of the linearly polarized laser pulse as orange-red colors. The longitudinal component of the laser field is used to represent the higher order modes and the main pulse with the same color code. On the bottom we show the z-averaged (within the full width at half maximum) absolute transverse field component at different time instances (solid curves) with the initial Gaussian-profile (dashed black curves) and we indicate the position at the channel radius (|y| = r_c) with vertical lines. Here \lambda_\mathrm p = 66\,\mum. In the mismatched case the laser field contains higher order modes with significant amplitude that propagate behind the main pulse due to mode dispersion, while the laser pulse preserves its Gaussian-profile in the matched case.
Temporal evolution of the acceleration: (a) Electron energy spectrum along the propagation distance. In (b) the axially averaged laser field modulus is shown, where the periodic focusing and defocusing of the laser pulse along the plasma channel is clearly visible. Each focusing triggers an injection event. The history of the axial density profile (\mathrm{log}_{10}[n_\mathrm e] with units of \mathrm m^{-3}) of the nonlinear wakefield is shown in (c), where the horizontal stripes correspond to the injected electron bunches moving with nearly the speed of light. (d) The peak electric field in the back of the bubble is shown by the red line, while the velocity of the node of the wave (phase velocity of the plasma wave) is shown by the black line. As indicated by the blue arrows, self-injection occurs, when the electric field is strong enough and the phase velocity is sufficiently low.
Perpendicular shock. Main panel—electron density in the shock region; left inset panel—electron density and the in-plane component of the magnetic field (arrows) in the region of the Weibel filament with magnetic reconnection; right inset panel—electrostatic field strength in the Buneman instability region. Shock transition includes the foot, ramp and overshoot regions and it spans from x/r_\mathrm{i} = 2.5 to x/r_\mathrm{i} = 3; the upstream is at x/r_\mathrm{i}\gt3 and the downstream is at x/r_\mathrm{i}\lt2.5. Shock parameters are v_\mathrm{sh} = 0.263c, M_\mathrm{A} = 68.9, M_\mathrm{s} = 106, m_\mathrm{i}/m_\mathrm{e} = 400 [32].
Particle energy spectrum at the shock with internal particle injection mechanisms [10]. \varepsilon_\mathrm{inj} is the injection energy and \varepsilon_\mathrm{th} is the energy of the thermalized downstream plasma.

![Temporal evolution of the acceleration: (a) Electron energy spectrum along the propagation distance. In (b) the axially averaged laser field modulus is shown, where the periodic focusing and defocusing of the laser pulse along the plasma channel is clearly visible. Each focusing triggers an injection event. The history of the axial density profile (\mathrm{log}_{10}[n_\mathrm e] with units of \mathrm m^{-3}) of the nonlinear wakefield is shown in (c), where the horizontal stripes correspond to the injected electron bunches moving with nearly the speed of light. (d) The peak electric field in the back of the bubble is shown by the red line, while the velocity of the node of the wave (phase velocity of the plasma wave) is shown by the black line. As indicated by the blue arrows, self-injection occurs, when the electric field is strong enough and the phase velocity is sufficiently low.](https://fusionpapers-figures.s3.ap-northeast-1.amazonaws.com/ppcfae1706f6.jpg)
![Perpendicular shock. Main panel—electron density in the shock region; left inset panel—electron density and the in-plane component of the magnetic field (arrows) in the region of the Weibel filament with magnetic reconnection; right inset panel—electrostatic field strength in the Buneman instability region. Shock transition includes the foot, ramp and overshoot regions and it spans from x/r_\mathrm{i} = 2.5 to x/r_\mathrm{i} = 3; the upstream is at x/r_\mathrm{i}\gt3 and the downstream is at x/r_\mathrm{i}\lt2.5. Shock parameters are v_\mathrm{sh} = 0.263c, M_\mathrm{A} = 68.9, M_\mathrm{s} = 106, m_\mathrm{i}/m_\mathrm{e} = 400 [32].](https://fusionpapers-figures.s3.ap-northeast-1.amazonaws.com/ppcfaca5b2f3.jpg)
![Particle energy spectrum at the shock with internal particle injection mechanisms [10]. \varepsilon_\mathrm{inj} is the injection energy and \varepsilon_\mathrm{th} is the energy of the thermalized downstream plasma.](https://fusionpapers-figures.s3.ap-northeast-1.amazonaws.com/ppcfaca5b2f1.jpg)