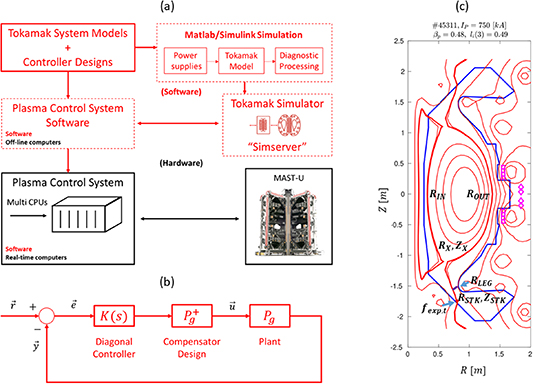
(a) MAST-U TokSys environment including the modeling environment is shown in the top boxes. MAST-U model-based closed-loop simulation environment is shown in the middle boxes. The actual MAST-U PCS/Tokamak closed-loop system is schematically shown in the bottom two boxes. (b) Simplified block diagram representation of plasma shape control algorithm for MAST-U. (c) MAST-U poloidal cross-section showing the conventional double null plasma magnetic equilibrium obtained with off-line EFIT, along with the location of the magnetic shape control variables. The magenta squares and diamonds give the position of the flux loops and magnetic probes used by LEMUR for reconstructing{ }{R_{{\text{OUT}}}}.
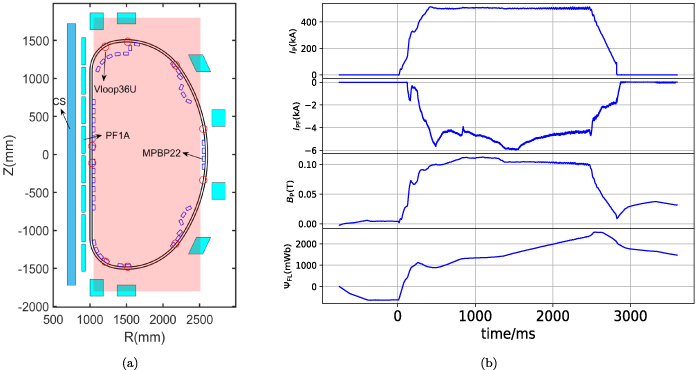
(a) Locations of probes for the poloidal magnetic field and loop voltage measurements on HL-3. The red circles represent the positions of 10 loop voltage measurement devices, and the blue square points indicate the locations of 41 poloidal magnetic field probes (only 39 of them are used in EFITNN). The blue and purple rectangular boxes correspond to the PF and CS coils, respectively. The pink rectangular area represents the region covered by the magnetic flux and current density distribution maps. (b) Curves from top to bottom are the plasmas current, PF coil current (selected from PF1A), poloidal magnetic field (selected from MPBP22), and the integration of the loop voltage (proportional to the poloidal magnetic flux, selected from VLoop36U). These data are collected from shot #3331.
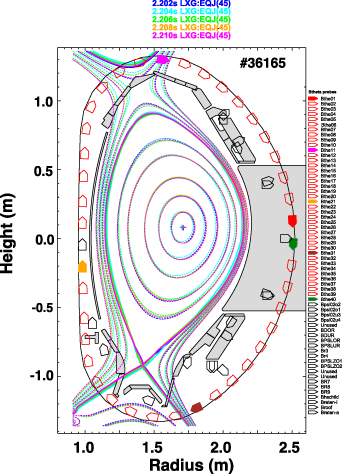
さらに、非軸対称な渦電流の影響も無視できない。プラズマの高速変動や機器構造中に誘起される渦電流は磁気測定を汚染するため、カルマンフィルタに基づく渦電流推定器を組み込んだり、プラズマ位置変調への応答を利用してドリフトのない再構成を行う手法が開発されている。JET ではエッジ局在モード(ELM)が再構成に与える影響が統計的に調べられている。図は ELM に応答して磁束面が動く様子を、2.0 ms 間隔の5つの再構成平衡で示したものである。
The poloidal position of the magnetic probes, with the poloidal array plotted in red. The 5 equilibria are separated in time by 2.0 ms and show the movement of the flux surfaces in response to an ELM.
近年は機械学習による高速化が活発である。オフライン平衡コードのデータベースで訓練したニューラルネットワークにより、磁束分布や電流密度分布、大域パラメータを一斉に予測する手法が複数の装置で試みられており、物理情報を損失関数に組み込む物理インフォームド・ニューラルネットワーク(PINN)や、マルチタスク学習構造を用いる例が報告されている。HL-3 で開発されたマルチタスク学習ネットワークでは、単一時間断面の計算が 0.08–0.90 ms で完了し、リアルタイム要件を満たすとともに、出力枝の追加・削除による拡張性が示されている。ベイズ的手法や人工知能による再構成改善も模索されているが、リアルタイム制御への適用は計算速度の向上に依存するとされる。
In the left panel, the flux surfaces \psi_N = [0\ 0.1 {\ldots} 1] are shown in red for the LIUQE + RAPTOR EKF equilibrium solution for a TCV H-mode plasma (discharge 64678 at 0.998 s). The TCV vessel geometry and TS measurement locations are also indicated. For the same time instant, the middle and right panels show the raw TS measurements as black dots (with diagnostic error bars), as well as the RAPTOR EKF estimate (red solid line), for both electron temperature Te (top) and electron density ne (bottom). The RAPTOR EKF estimates are obtained by applying the diagnostic response model to the state estimate, i.e. M_{\mathrm{TS},k} \hat{x}_{k|k}. The right panels show a zoom of the region where the TS laser chord intersects the lower half of the LCFS.
図の左は TCV の H モード放電について再構成された磁束面(赤)とトムソン散乱測定の視線を示し、中央と右は電子温度・電子密度の実測値(黒点、誤差バー付き)と推定値(赤実線)の比較、および分離限界面近傍の拡大図である。この種の統合では、平衡解が外部磁気測定と内部プロファイル推定の両方を最小二乗で満たすように求められ、得られた平衡はトムソン散乱測定を磁束面座標に写像するためにも一貫して使われる。診断被覆が限られる核融合炉(DEMO)では、この種のモデルベース推定への依存がさらに強まると予想されている。EAST では、非誘導電流の物理モデル計算値と平衡電流の整合性そのものを新しい制約として再構成に組み込む手法も提案されている。

![In the left panel, the flux surfaces \psi_N = [0\ 0.1 {\ldots} 1] are shown in red for the LIUQE + RAPTOR EKF equilibrium solution for a TCV H-mode plasma (discharge 64678 at 0.998 s). The TCV vessel geometry and TS measurement locations are also indicated. For the same time instant, the middle and right panels show the raw TS measurements as black dots (with diagnostic error bars), as well as the RAPTOR EKF estimate (red solid line), for both electron temperature Te (top) and electron density ne (bottom). The RAPTOR EKF estimates are obtained by applying the diagnostic response model to the state estimate, i.e. M_{\mathrm{TS},k} \hat{x}_{k|k}. The right panels show a zoom of the region where the TS laser chord intersects the lower half of the LCFS.](https://fusionpapers-figures.s3.ap-northeast-1.amazonaws.com/nfae2c0af1.jpg)